Introduction
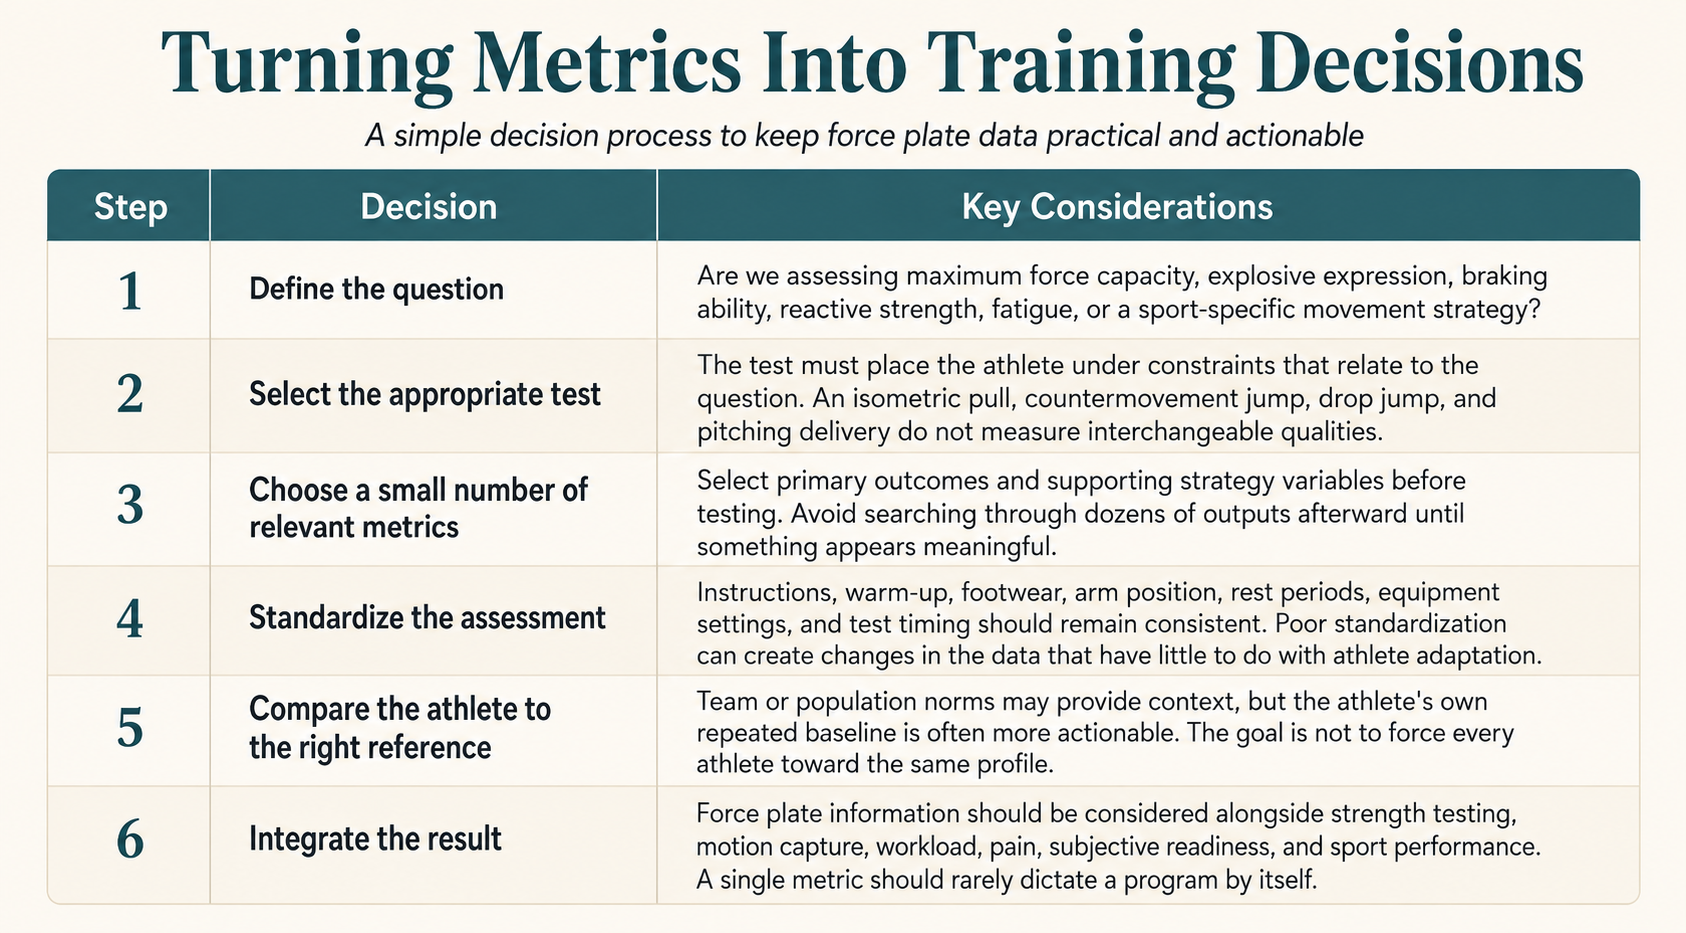
Force plate software can produce dozens, sometimes hundreds, of variables from a single assessment. The challenge is rarely obtaining more data. The challenge is deciding which information answers the question in front of us.
In Part 1, we established that force plates measure how an athlete interacts with the ground. We also separated two common applications in baseball: standardized physical performance testing and sport-specific biomechanical analysis. This follow-up moves one step deeper by examining the major categories of force plate metrics, what they represent, and how they can influence training decisions.
The goal is not to memorize every variable in a force plate report. It is to understand the physical qualities behind the numbers well enough to determine which metrics are relevant, which require more context, and which may simply add noise.
Start With the Force-Time Curve
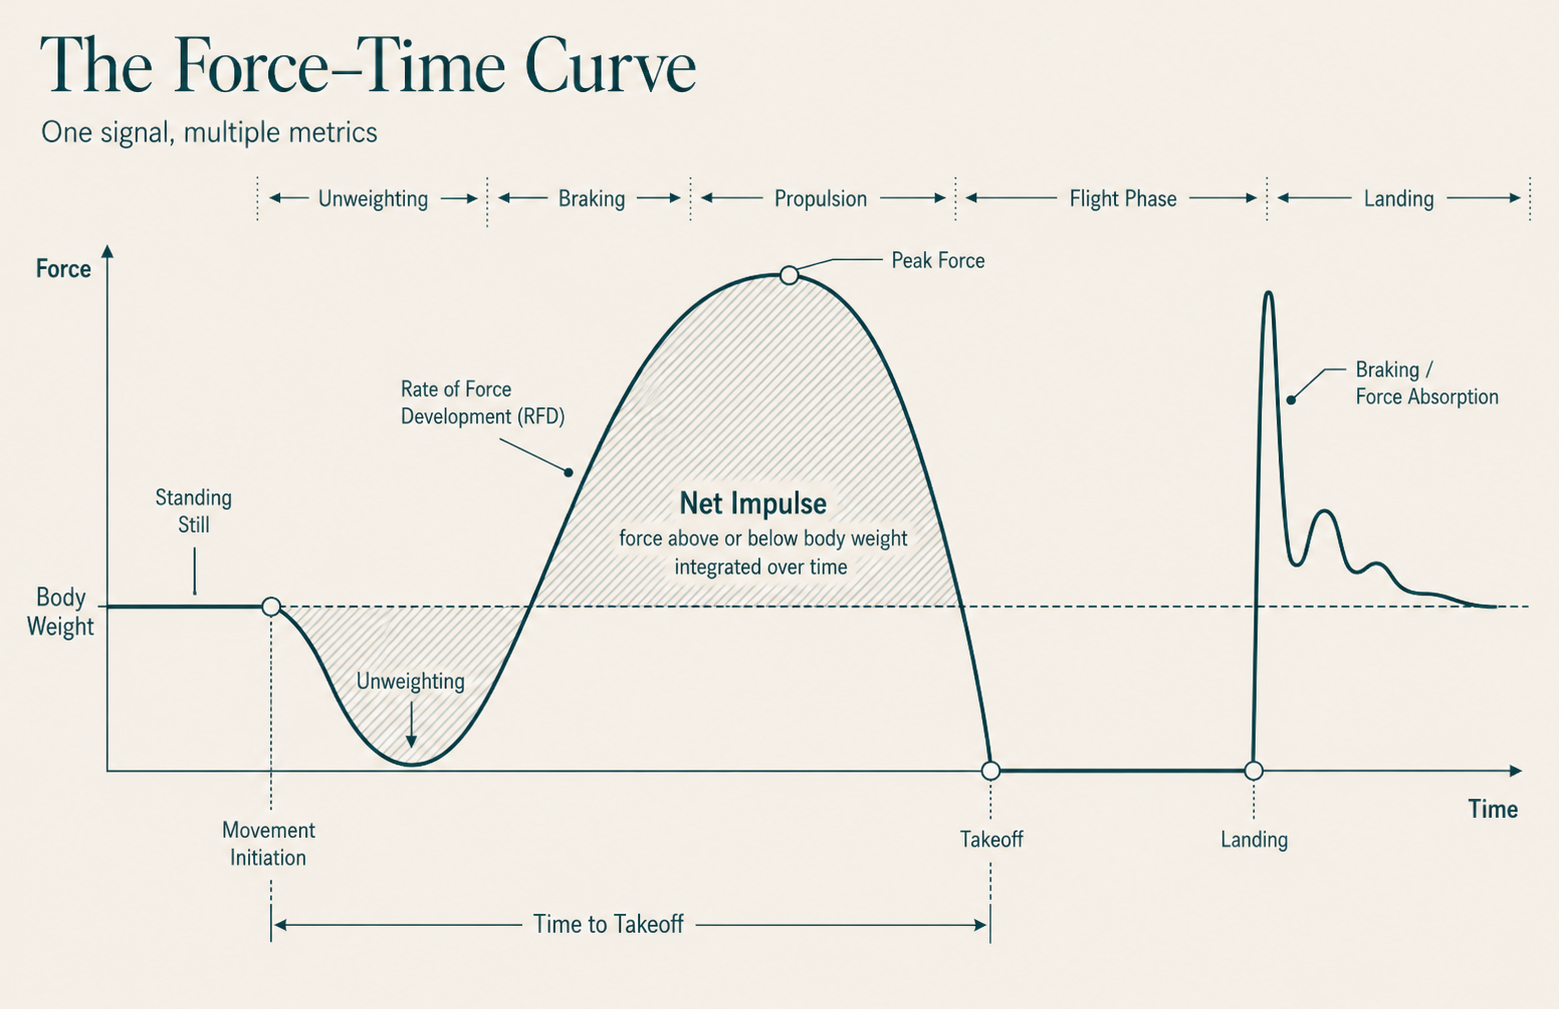
Most force plate metrics are derived from the same underlying signal: force measured over time. Imagine recording a countermovement jump. The athlete begins by standing still, lowers into the countermovement, reverses direction, accelerates upward, leaves the ground, and eventually lands. The shape of the force-time curve reflects each of these phases. Software can then extract values such as peak force, impulse, rate of force development, and phase duration from that curve. These variables are different ways of describing the same movement.
This matters because two athletes can achieve the same jump height using different strategies. One may apply a large amount of force over a short period of time. Another may produce less force but apply it over a longer period. The outcome may look identical, while the physical solution used to create it is not.
That is why the curve and the movement that produced it often provide more context than any isolated number.
1. Maximum Force Production
Maximum force metrics describe the highest force an athlete produces during a test. The most familiar example is peak force, which is simply the greatest instantaneous force recorded during a defined phase of movement.
Peak force is commonly evaluated during:
- Isometric mid-thigh pulls
- Isometric squats
- Countermovement jumps
- Squat jumps
- Single-leg jump or landing tasks
In an isometric test, peak force can help estimate an athlete's maximum force-producing capacity in a standardized position. In a jump, however, peak force is influenced by the movement strategy, countermovement depth, body mass, and the time available to produce force.
This creates an important distinction: producing a large force is not automatically the same as producing force effectively.
A heavier athlete will typically produce more absolute force than a lighter athlete. For comparisons between athletes, force is therefore often normalized to body mass and reported in newtons per kilogram. Even then, the number should be interpreted alongside the demands of the athlete's position, training history, and sport.
Practical application
If a pitcher demonstrates low force relative to body mass during an isometric squat, increasing general lower body strength may be appropriate. If that same pitcher already possesses high maximum force but struggles to express it during fast movements, adding more maximalstrength work may not address the primary limitation or rate limiting factor.
The coaching question is not simply,“How strong is the athlete?” It may be better to ask,the athlete have enough force capacity, and can that capacity be expressed within the timeavailable in the throw or swing?”
2. Speed of Force Production
Baseball movements happen quickly. A pitcher or hitter does not have enough time to allow peak force to occur or be built over several seconds but rather fractions of a second. For this reason, how quickly force is produced may be as important as the maximum force itself.
Rate of force development, commonly abbreviated as RFD, describes the change in force divided by the change in time:
RFD = change in force/change in time
RFD may be reported over specific time intervals, such as the first 100 or 200 milliseconds, or calculated as the steepest slope of the force-time curve.
Although the concept is straightforward, RFD is highly sensitive to testing methodology. Small differences in the detected start of contraction, athlete instruction, joint position, filtering, and the selected time window can substantially change the result. This makes standardization essential and comparisons across different systems or protocols difficult.
Practical application
An athlete with adequate peak force but limited early force production may benefit from training that emphasizes rapid intent, ballistic movements, jumps, throws, or explosive isometrics. An athlete who is limited in both maximum force and RFD may still need to raise the underlying force ceiling before expecting large improvements in rapid force expression.
RFD should not be viewed as a single quality that exists independently of maximum strength. The amount of force an athlete can produce and the speed at which it becomes available are related, but their importance changes depending on the time window and task.
3. Impulse: Force Applied Over Time
Impulse = force × time
More precisely, net impulse represents force above or below body weight integrated over time. Impulse changes momentum, making it one of the most mechanically meaningful variables available from a force plate.
During a countermovement jump, concentric net impulse determines takeoff velocity and therefore jump height. During pitching, horizontal and vertical impulses help describe how the athlete changes the momentum of the body throughout the delivery. During landing, braking impulse describes how momentum is reduced after ground contact.
Two athletes may create the same impulse differently. One may use higher force over less time; the other may use lower force over more time. Neither strategy is automatically better. The demands of the task determine whether the athlete has enough time to use the strategy effectively.
Practical application
Impulse can help distinguish an athlete who lacks force from one who simply relies on a longer time to apply it. That distinction matters when selecting exercises.
For example, a long-duration strategy may be successful during an unrestricted countermovement jump but less transferable to a rapid change of direction or the time constraints of pitching. Training could then progress toward expressing sufficient impulse in shorter time windows rather than chasing a larger peak value alone.
4. Braking and Force Absorption
Athletes must do more than produce force. They must also absorb and redirect it.
During a countermovement jump, the athlete first accelerates downward and then applies force to slow the center of mass before reversing direction. During a landing, the athlete must reduce downward momentum. In pitching, the lead leg contributes to breaking the forward motion of the body and creating a stable base from which rotation can continue up the kinetic chain.
Common braking variables include:
- Braking impulse
- Peak braking force
- Braking RFD
- Time to stabilization
- Landing stiffness
- Eccentric deceleration rate
These values must be interpreted carefully. A higher peak braking force may reflect a useful
ability to tolerate and redirect load, but it may also occur because the athlete lands with a stiffer strategy or absorbs force over less time. Without kinematic information, we cannot assume whether the strategy is efficient, desirable, or potentially problematic.
If an athlete produces adequate concentric output but demonstrates limited braking impulse or poor control during landing tasks, the program may place greater emphasis on deceleration, eccentric strength, single-leg landing competency, and the ability to accept force in multiple directions. For pitchers, lead-leg force should not be reduced to “more braking is better.” The timing, direction, and coordination of the braking force relative to pelvis and trunk motion determine how it contributes to the delivery.
5. Stretch-Shortening Cycle Efficiency
Many athletic actions involve a rapid eccentric action followed by a concentric action. This is known as the stretch-shortening cycle. The drop jump is frequently used to assess this quality. One of its most common outputs is the reactive strength index, or RSI:
RSI = jump height / ground contact time
RSI rewards the ability to jump high while spending little time on the ground. A related metric, RSI modified, is often calculated during a countermovement jump:
RSI-modified = jump height / time to takeoff
Although the names are similar, the tests represent different constraints. A drop jump emphasizes rapid ground-contact behavior and fast stretch-shortening cycle function. A countermovement jump allows more time and reflects a different expression of force and power.
Practical application
An athlete with strong jump output but a low RSI may be capable of producing force when time is available yet struggle to express it rapidly during shorter contacts. This profile may support the use of appropriately progressed plyometrics, stiffness-oriented tasks, and exercises that constrain ground-contact time.
The athlete's technical competency and training history still matter. A low RSI in an athlete who has little experience with drop jumps may reflect unfamiliarity with the task rather than a true physiological limitation.
6. Movement Strategy
Some of the most useful force plate metrics describe how an athlete completed a task rather than only the final output.
In a countermovement jump, strategy variables may include:
- Countermovement depth
- Time to takeoff
- Braking and propulsive phase durations
- Eccentric and concentric impulse
- Force at minimum displacement
- Eccentric-to-concentric ratio
An athlete can maintain jump height even as the underlying strategy changes. For example, during periods of fatigue, the athlete may use a deeper countermovement or spend more time producing force to preserve the same outcome. If we look only at jump height, we may conclude that nothing changed. The force-time curve may tell a different story.
This does not mean every strategy change represents fatigue or dysfunction. Athletes naturally possess different movement solutions, and strategy can change with intent, warm-up, soreness, training phase, or familiarity with the test.
Practical application
Strategy variables become most useful when an athlete is compared to their own established baseline. A meaningful shift in time to takeoff, countermovement depth, or phase contribution may prompt a conversation about training load, readiness, pain, or compensation even when the headline performance metric remains stable.
What About Asymmetry?
Dual force plates allow practitioners to estimate how each limb contributes to bilateral tasks. This can be useful, particularly during rehabilitation, return-to-play progression, and longitudinal monitoring.
However, asymmetry is not one universal value. An athlete may favor one limb during braking and the other during propulsion. The magnitude and even direction of asymmetry can change depending on the test, metric, and phase of movement.
Baseball adds another layer of complexity because the sport is inherently asymmetric. Pitchers and hitters repeatedly perform directional, unilateral actions. A difference between limbs is therefore not automatically a deficit that must be corrected.
Rather than asking whether an athlete is perfectly symmetrical, better questions include:
- Is the asymmetry consistent across repeated trials?
- Is it specific to one metric or phase?
- Has it changed from the athlete's normal profile?
- Is it accompanied by pain, reduced performance, or altered movement?
- Does it make sense in the context of the athlete's role and injury history?
Asymmetry can identify where to investigate. By itself, it does not provide a diagnosis or predict an injury with certainty.
Turning Metrics Into Training Decisions
A Simple Example
Consider a pitcher whose countermovement jump height has remained unchanged across an offseason training block.
Looking only at jump height may suggest that the program produced no adaptation. A deeper review, however, shows that the athlete now achieves the same height with a shorter time to takeoff and a shallower countermovement. Peak force changed very little, but force was expressed more rapidly, and the same net impulse was generated in less time.
That may represent a meaningful improvement for a time-constrained sport, even though the most visible output did not change.
Now consider the opposite situation. Jump height remains stable, but the athlete uses a progressively deeper countermovement and longer contraction time following a period of high throwing and lifting volume. The athlete is still completing the task, but at a greater time cost. That strategy change may justify additional recovery, a reduction in training volume, or simply closer monitoring.
The number only becomes meaningful when we understand how it was produced and why it matters.
Conclusion
Force plate metrics are not independent scores that define an athlete. They are different descriptions of force applied across time within a specific task.
Maximum force, RFD, impulse, braking, reactive strength, and movement strategy each answer a different question. Their value depends on selecting the right test, using a consistent protocol, and interpreting the result within the context of the athlete and the demands of baseball.
The objective is not to collect the largest possible report. It is to reduce complex data into a small number of observations that improve the next coaching decision. Technology gives us the measurement. Context gives it meaning.
References
Bishop, C., Turner, A., & Read, P. (2018). Effects of inter-limb asymmetries on physical and sports performance: A systematic review. Journal of Sports Sciences, 36(10), 1135–1144. https://doi.org/10.1080/02640414.2017.1361894
Chavda, S., Bromley, T., Jarvis, P., Williams, S., Bishop, C., Turner, A. N., Lake, J. P., & Mundy,P. D. (2018). Force-time characteristics of the countermovement jump: Analyzing the curve in Excel. Strength & Conditioning Journal, 40(2), 67–77. https://doi.org/10.1519/SSC.0000000000000353
Comfort, P., Dos'Santos, T., Beckham, G. K., Stone, M. H., Guppy, S. N., & Haff, G. G. (2019). Standardization and methodological considerations for the isometric mid-thigh pull. Strength & Conditioning Journal, 41(2), 57–79. https://doi.org/10.1519/SSC.0000000000000433
Cormie, P., McGuigan, M. R., & Newton, R. U. (2011). Developing maximal neuromuscular power: Part 1—Biological basis of maximal power production. Sports Medicine, 41(1), 17–38. https://doi.org/10.2165/11537690-000000000-00000
Gathercole, R., Sporer, B., Stellingwerff, T., & Sleivert, G. (2015). Alternative countermovement-jump analysis to quantify acute neuromuscular fatigue. International Journal of Sports Physiology and Performance, 10(1), 84–92. https://doi.org/10.1123/ijspp.2013-0413
Howenstein, J., Kipp, K., & Sabick, M. B. (2020). Peak horizontal ground reaction forces and impulse correlate with segmental energy flow in youth baseball pitchers. Journal of Biomechanics, 108, 109909. https://doi.org/10.1016/j.jbiomech.2020.109909
Lake, J., Mundy, P., Comfort, P., McMahon, J. J., Suchomel, T. J., & Carden, P. (2018). Concurrent validity of a portable force plate using vertical jump force-time characteristics. Journal of Applied Biomechanics, 34(5), 410–413. https://doi.org/10.1123/jab.2017-0371
Suchomel, T. J., Nimphius, S., & Stone, M. H. (2016). The importance of muscular strength in athletic performance. Sports Medicine, 46(10), 1419–1449. https://doi.org/10.1007/s40279-016-0486-0